
Describe the operating change before calculating its effect
A reclaimer may increase annual tonnage by operating longer, taking deeper cuts or spending more time at heavily loaded boom positions. A feeder may achieve extra output through a new speed range. These changes need different assessments, even if they produce the same increase in tonnes.
Recover the duty assumed in the existing assessment and compare it with current records and proposed operation. Identify operating hours, starts, stops, movement cycles, material conditions and the periods spent in each state. Include cleared blockages, interruptions and recovery operations where relevant. One luffing movement is an operating event; its stress response determines the fatigue cycles at each detail.
Operators can help identify conditions that warrant investigation, such as repeated impacts or visible movement during a particular cut, machine position or loaded start. Record what was observed, when it occurred and the operating conditions. Use measurements and engineering assessment to establish the cause, its effect on the structure and whether action is required.
If operators change cut depth, speed, sequence or the number of starts to avoid the reported behaviour, record those changes. They may reduce one demand while increasing another. Use these records to define the investigation and assess any interim operating limits. Verify the eventual solution under the intended operating conditions.
Start by checking whether the existing fatigue assessment covers the proposed duty, cumulative cycle counts, earlier exposure, configuration, condition and intended service period. Lower stress per cycle does not establish coverage if exposure increases. Where traceable evidence or a justified conservative bound demonstrates coverage, record the conclusion and its limits. Otherwise, target further assessment or measurement at the gap that could change the decision.
Follow the loading to the physical detail
Fatigue assessment needs the stress ranges and occurrence counts at a defined location. A maximum stress contour or peak cylinder pressure is insufficient. Establish which operating events contribute to that location and how the structure transfers their loads.
The IIW recommendations describe representative stress histories, cycle counting and stress spectra. [1] They distinguish methods that use nominal stress, structural hot spot stress or local notch stress. Each method requires a compatible fatigue resistance curve. These stress measures are not interchangeable.
For hollow section joints, CIDECT Guide 8 explains the influence of non uniform joint stiffness and secondary bending. [2] This matters when a whole machine model predicts member forces satisfactorily but does not resolve the local deformation governing a weld.
A detail that already contains a crack requires assessment of that crack and its implications for service. An initially uncracked fatigue calculation does not clear the indication for continued operation.
Investigate vibration through excitation and response
Begin with plausible excitation: bucket engagement, rotating equipment, feeder forces, belt transitions, starts, stops and impacts. Then establish the corresponding structural response. Visible boom movement can help locate an operating condition, but substantial movement does not necessarily mean high local stress, and damaging local cycles can occur without obvious global motion.
Record speed, machine position, material state and the action occurring with the response. Where several exciters operate, examine their frequencies and relative response rather than assuming they must always be synchronised. Frequency proximity alone does not prove resonance; excitation direction, mode shape, damping and restraint affect the result.
Check the actual support condition before adding stiffness. Loose connections, altered springs, accumulated material or changed equipment mounting can invalidate the earlier dynamic model. WA Bulletin 124 includes cracking of vibrating screen underpans where support details were inadequate for the dynamic loading. [3] The lesson is to connect the excitation to the load transfer and detail.
Where testing is justified, use an approved operating envelope, defined measurement plan and stop criteria. Do not expand a speed trial through an unexplained high response region simply to complete a curve. Modal analysis and controlled response measurements should test the proposed mechanism.
Measure what will change the decision
Use vibration measurements to describe dynamic response, strain where local stress response is needed, and pressure, speed and position records to identify the operating state. Select locations, directions, ranges and sampling with the assessment method in mind. One well matched channel does not validate every weld or load case.
Synchronise the channels needed to relate actions and response. Preserve raw data and record calibration, missing periods, clipping and corrections. A saturated sensor hides the true peak; joining records across a gap can create false excursions. Establish which operating states and durations the records actually represent before extrapolating to annual duty.
Preserve genuine cycles that cross consecutive file boundaries. Processing continuous records as independent files can lose transition cycles; document the treatment of unfinished rainflow cycles, where mean loading varies slowly. [5]
Choose between measurement, a bounded sensitivity study and further modelling according to the unresolved decision. Collecting more data without a testable question can consume a shutdown while leaving the assessment unchanged.
Accumulate the relevant events at the same location
Consider a boom connection whose upper corner responds most strongly to digging and whose lower corner responds most strongly to luffing. Assess the complete applicable history at each corner. The lower digging response still contributes at the lower corner, and the lower luffing response may contribute at the upper corner.
Where actions overlap, preserve the sign, direction and relative timing of compatible stress components before counting cycles. Simple superposition requires an appropriate linear response model. Changing contact or restraint, significant rotation of principal stress directions, or interacting normal and shear stresses may require a different analysis or a suitable multiaxial fatigue method. For separate operating periods, combine their assessed contributions with the corresponding occurrence counts. Avoid adding incompatible independent maxima or counting the same exposure twice.
Favourable cancellation between simultaneous actions can only be credited where evidence supports that relationship across the relevant operating states and configurations. Where timing is uncertain, assess plausible combined histories or justified bounds.
A spectrum from a short trial needs a justified link to the range of service conditions. A smooth, lightly loaded commissioning run cannot represent years of reclaiming without evidence that the relevant states and events are covered.
| Operating change | Question at the detail | Assessment consequence |
|---|---|---|
| More operating hours | Are the stress ranges comparable? | Increase counts and test spectrum changes |
| Heavier cuts or material loading | Which ranges and locations increase? | Update loads and local response |
| New speed or movement range | Does the response change with state? | Assess affected states and transitions |
| Upgrade deferred to a shutdown | What exposure occurs before installation? | Keep earlier and modified configurations separate |
Use sensitivity calculations to expose the consequence
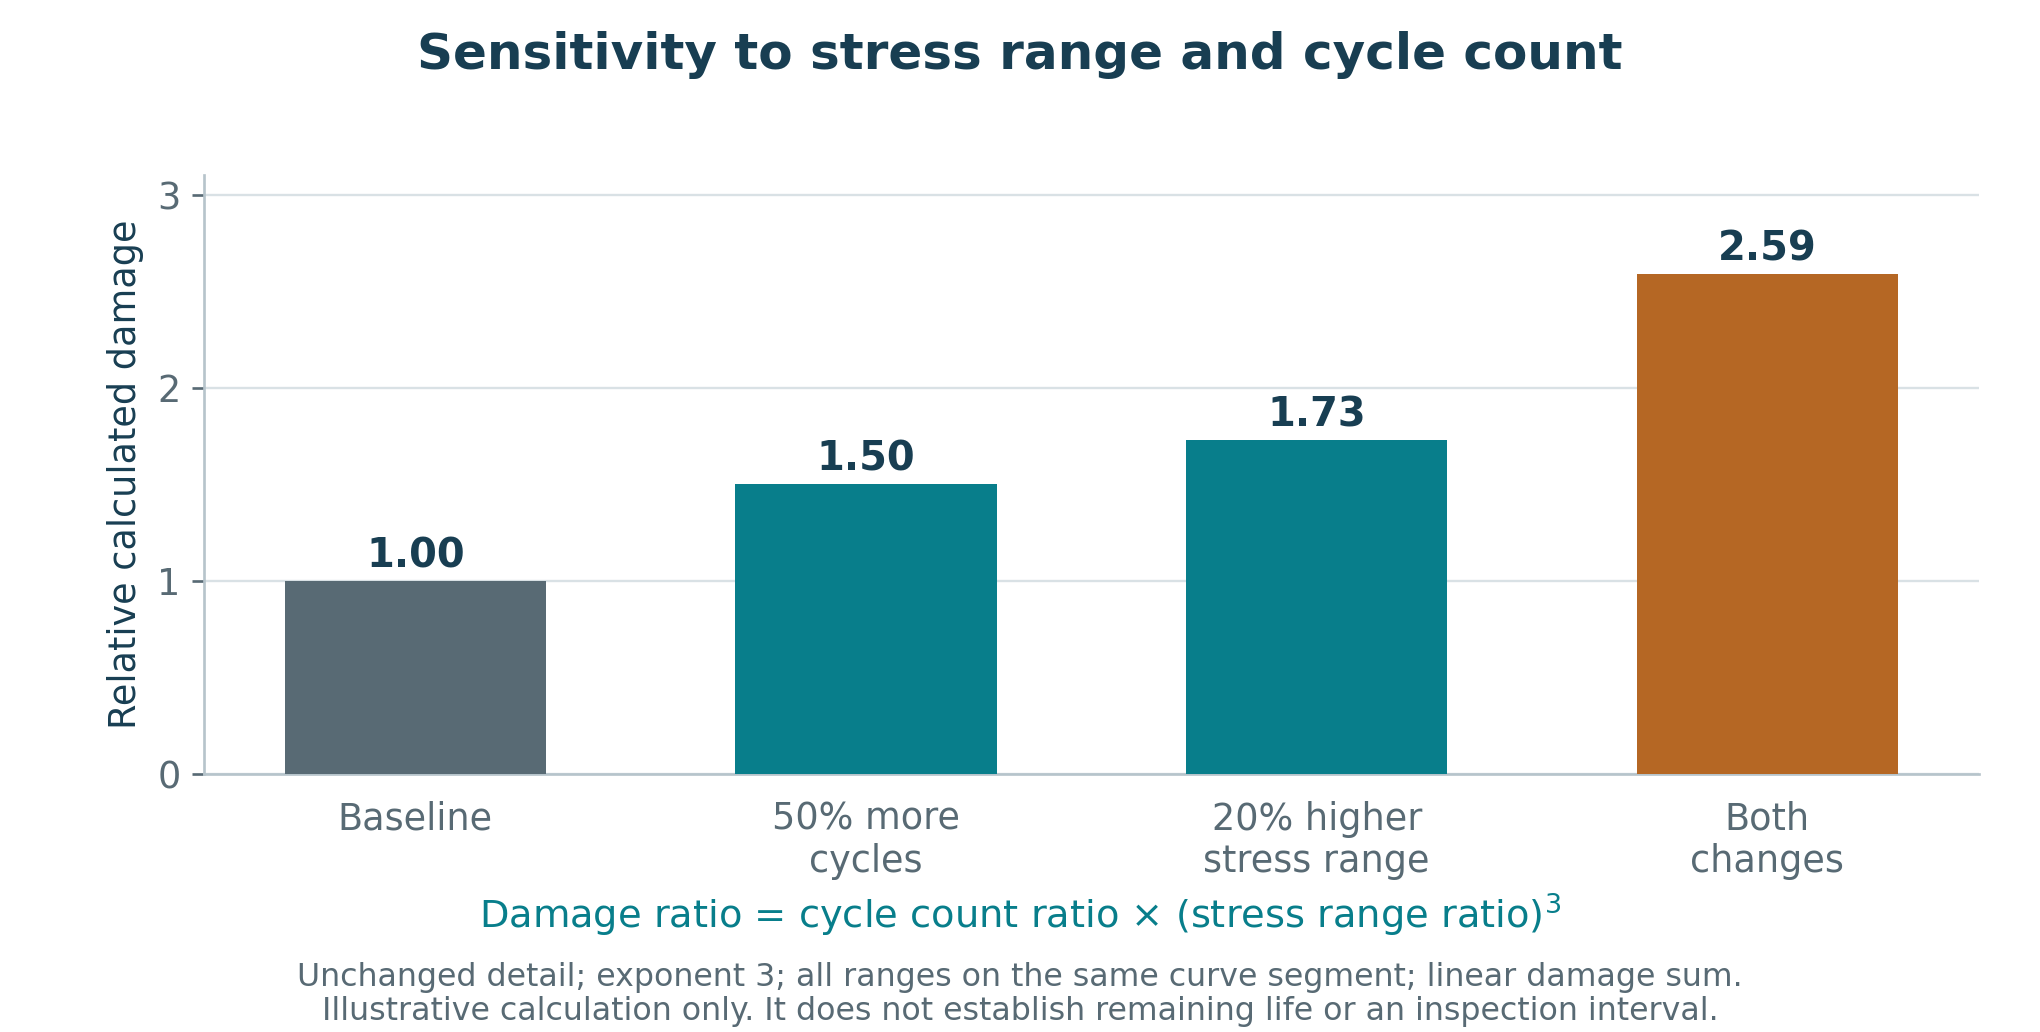
A simple illustrative comparison assumes an unchanged detail, all relevant ranges on a fatigue curve segment with exponent 3, and linear cumulative damage. A 20% stress range increase then gives 1.2³ = 1.73 times the calculated damage contribution at unchanged cycle count. Increasing cycles by 50% as well gives 1.5 × 1.2³ = 2.59 times the contribution. [1]
Apply these ratios only to the affected cycles. They cannot automatically multiply the entire service history or unaffected operating states. A throughput increase does not establish the same increase in stress range. These comparisons do not predict a crack date, percentage of physical life consumed or inspection interval. The adopted assessment basis governs the curve, range limits, allowable damage and safety provisions; condition and earlier exposure remain essential inputs.
Include the waiting period and verify the intervention
An approved reinforcement does not change the structure until it is installed. Record interim duty and the operating basis covering the period between recognising the issue and completing the work. Use the installation date as a configuration change point; retain the relevant exposure history of material that remains.
A repair may establish a new fatigue basis for the treated detail where crack removal, the resulting geometry, weld quality and the selected method support it. Untreated neighbouring details retain their earlier exposure. Reassess new reinforcement terminations and changed load transfer; do not carry an old damage number unchanged into a different detail or failure mode.
Select mitigation for the established mechanism. Options may include correcting a support defect, changing excitation, revising an assessed operating range or modifying the structural detail. Reducing motion at one location is insufficient if cyclic stress transfers to an adjacent connection.
Coordinate speed, acceleration, braking and protection changes with the appropriate mechanical and control specialists. Schmidt and van Rensburg’s bulk handling case studies demonstrate the consequences of poor integration between equipment capability, protection and structural design. [4] Their historical standards commentary does not establish current Australian requirements.
Verify the changed configuration under comparable, representative conditions and check the details affected by redistributed loads. Where inspection supports continued service, address crack condition or an adopted flaw basis, detection capability, growth and the consequences of failure. A calculation using a stress versus cycle curve alone does not establish the remaining life of a known crack or an inspection interval.
The recommendation should state whether the proposed duty is covered, which details govern, any justified operating or maintenance measures, and the evidence needed to resolve material uncertainty. Consider strength, stability and protection settings where affected. ACE connects structural assessment to practical operating, inspection and upgrade decisions.
References
[1] Hobbacher, A. (2008). Recommendations for Fatigue Design of Welded Joints and Components. IIW-1823-07, sections 2.2–2.3, pp. 20–40; section 3.2; sections 4.3–4.4, pp. 109–115; section 5.5.
[2] Zhao, X.-L. and colleagues (2000; 2001 printing). Design Guide for Circular and Rectangular Hollow Section Welded Joints under Fatigue Loading. CIDECT Design Guide 8, sections 3.1–3.5, pp. 26–28.
[3] Department of Mines and Petroleum, Western Australia (2015). Structural safety of buildings, plant and other structures. Mines Safety Bulletin 124, pp. 2–3. Read source
[4] Schmidt, M. J. and van Rensburg, B. W. J. (2015). Avoiding structural failures on mobile bulk materials handling equipment. Journal of the Southern African Institute of Mining and Metallurgy, 115, pp. 179–184, see pp. 180–183. Read source
[5] Marsh, G. and colleagues (2016). Review and application of Rainflow residue processing techniques for accurate fatigue damage estimation. International Journal of Fatigue, 82, pp. 757–765. DOI 10.1016/j.ijfatigue.2015.10.007. Read source
Further reading
Hobbacher, A. F. and Baumgartner, J. (2024). Recommendations for Fatigue Design of Welded Joints and Components. Third edition, Springer, IIW Collection. Read source